Learning how to read an economic calendar takes one sitting, and it can keep you from buying a stock at the jumpiest minute of the week. An economic calendar lists the government reports due out each day, the exact time each one lands, what economists expect it to show and what it showed last time. Once you know which three of those columns matter, a calendar stops looking like a wall of numbers and starts looking like a schedule for your week.
The short version
- Each row on an economic calendar is one report: the release time, the name, an importance flag and three numbers (actual, forecast and previous).
- Stocks react to the gap between the actual number and the forecast, not to whether the number sounds good or bad.
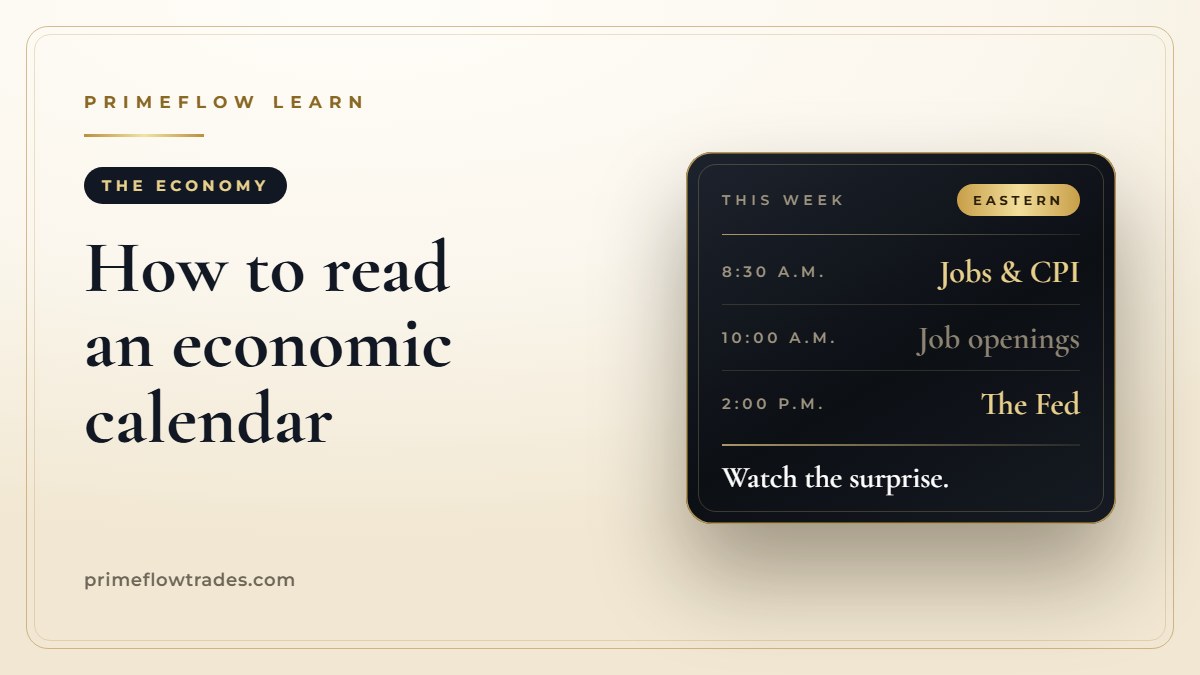
- The jobs report and the CPI inflation report land at 8:30 a.m. Eastern, an hour before the opening bell, so the first reaction shows up in premarket prices.
- Job openings come out at 10:00 a.m., half an hour into the session. Fed rate decisions come out at 2:00 p.m. on the last day of each meeting.
- Check the week’s calendar on Sunday night and you’ll know which mornings to wait before you buy.
What an economic calendar shows
Every row on the calendar is one report. Reading left to right, you’ll usually see:
- Time. When the report is released. Many calendars convert to your local time, so check which zone you’re looking at. U.S. reports are scheduled in Eastern time.
- Report name. Often shortened: “CPI m/m” is the Consumer Price Index, month over month. “JOLTS” is the government’s count of job openings.
- Importance. One to three stars, or a red, orange or yellow flag. The calendar’s publisher sets this, not the government, and it’s a rough guess at how much the report could move markets.
- Actual. Blank until the release, then filled in the moment the number comes out.
- Forecast. What economists expect. Some calendars call it “consensus,” and it’s usually the middle of the estimates gathered before the release.
- Previous. The last reading. When the government revises it, many calendars show the updated figure.
One trap catches new readers: the same report can appear twice, once month over month and once year over year. Compare the actual and the forecast on the same row, never across rows.
Actual vs. forecast: why the surprise moves stocks
By the time a report comes out, the forecast is already built into stock prices. Investors bought and sold on that expectation for days. What moves the market at 8:30 a.m. is the difference between what economists expected and what the government actually reported.
Say the forecast for monthly inflation is 0.3% and the actual comes in at 0.4%. Prices rose faster than expected, which raises the odds that interest rates stay higher for longer, and higher rates tend to weigh on stocks. If the actual lands right on the forecast, the report often passes with barely a ripple, even when the number itself sounds alarming.
The same logic explains a move that confuses a lot of people. A strong jobs report can knock stocks down. More jobs is good news for the economy, but if hiring runs far ahead of the forecast, investors start to worry the Federal Reserve will keep rates high to cool things off. The question the market is asking isn’t “is this good?” It’s “is this better or worse than we planned for, and what will the Fed do about it?”
Watch the previous column too. If last month’s number gets revised sharply, that change can matter as much as the new reading.
Which economic reports move the stock market
Dozens of reports come out every month, but a handful get most of the attention:
| Report | Release time (Eastern) | What it tells you |
|---|---|---|
| Jobs report | 8:30 a.m., usually a Friday early in the month | How many jobs were added and the unemployment rate |
| CPI inflation | 8:30 a.m. | How fast prices are rising. “Core” CPI leaves out food and energy. |
| Job openings (JOLTS) | 10:00 a.m. | How many jobs employers are trying to fill |
| Fed rate decision | 2:00 p.m., last day of the meeting | Where the Fed sets its benchmark interest rate |
The Bureau of Labor Statistics publishes the jobs report, CPI and job openings, and posts every release date a year ahead. The October jobs report, for example, came out at 8:30 a.m. on Friday, November 6, 2026, and showed 165,000 jobs added with unemployment at 4.1%.
The Fed’s rate-setting committee holds eight scheduled meetings a year. On October 28, 2026, its statement went out at 2:00 p.m. and held the rate between 3.75% and 4%. The Fed sits at the center of everything else on the calendar, because traders read every jobs and inflation number with one question in mind: does this make the Fed more likely to raise, hold or cut?
What time do economic reports come out?
The release time matters as much as the report, because it decides where the reaction shows up.
8:30 a.m. reports land an hour before the 9:30 opening bell. The first reaction happens in premarket trading, when far fewer people are buying and selling and prices can swing hard on small orders. Our guide to premarket trading explains why many of those early moves fade once the full market arrives, and a stock that gaps up at the open on report day faces the same test.
10:00 a.m. reports land half an hour into the session. A stock you bought at 9:45 can jump or drop at 10:00 for reasons that have nothing to do with the company. That’s one more reason many traders follow the 10 a.m. rule and wait out the first half hour.
2:00 p.m. Fed decisions hit the afternoon. The Fed chair’s press conference follows the statement, and the market’s first reaction can turn around while the questions are still being answered.
How to plan your trading day around the economic calendar
A few habits turn the calendar into a plan:
- Sunday night, look at the week ahead. Our economic calendar this week page lists the big reports with their Eastern times. Circle the mornings that matter.
- On an 8:30 morning, read the premarket after the number, not before. The prices at 8:00 were set before anyone knew the result.
- Don’t buy in the first minutes after a report. Decide your buy price ahead of time and place a limit order at that price, so the market has to come to you.
- On Fed days, decide what you’re holding before 2:00. Making that choice in the middle of the press conference is how people sell at the low.
If you’re holding a stock for weeks, one morning’s report is a bump in the road, not a reason to rip up the plan. That’s how PrimeFlow alerts are built to be used. Every alert gives you the buy price, two profit targets and a runner we let ride, all set before the trade. Our guide to reading a trade alert walks through each number.
Our VSH alert went out at a buy price of $33.95 on May 8, 2026, and the stock reached $63.27 on June 3, 2026: up 86% in 26 days. Across our public trade log, 407 of our first 427 closed alerts were winners. If you’d like to see how we hold a position for weeks without watching every report, our free 40-Day Retirement Position guide lays it out.
Common questions
How do you read an economic calendar?
Find the release time, the report name and its importance flag, then compare two numbers: the forecast, which is what economists expect, and the actual, which fills in at release time. The gap between them is what moves stocks. The previous column shows the last reading for context.
What does forecast mean on an economic calendar?
The forecast, often called the consensus, is what economists expect the report to show. It is usually the middle of the estimates the calendar’s publisher gathered before the release, and it is already reflected in stock prices before the number comes out.
What is the difference between actual, forecast and previous?
Actual is the number the government releases. Forecast is what economists expected. Previous is the reading from the last report, sometimes revised. Markets react mostly to the difference between actual and forecast.
What time is the jobs report released?
The Bureau of Labor Statistics releases the monthly jobs report at 8:30 a.m. Eastern, usually on a Friday early in the month. That is an hour before the stock market opens, so the first reaction shows up in premarket trading.
What time does the CPI report come out?
The Consumer Price Index comes out at 8:30 a.m. Eastern on the date the Bureau of Labor Statistics posts in its release schedule. Like the jobs report, it lands an hour before the opening bell.
What time is the Fed announcement?
The Federal Reserve releases its rate decision at 2:00 p.m. Eastern on the last day of each meeting, and the Fed chair holds a press conference afterward. There are eight scheduled meetings a year.
Sources
- BLS: Employment Situation release schedule
- BLS: The Employment Situation, October 2026
- BLS: Consumer Price Index release schedule
- BLS: Consumer Price Index, October 2026
- BLS: Job Openings and Labor Turnover release schedule
- Federal Reserve: FOMC meeting calendars
- Federal Reserve: FOMC statement, October 28, 2026
Release times and dates are summarized for general education and were checked on the BLS and Federal Reserve release pages on November 12, 2026. Agencies can change their schedules, so confirm upcoming dates on the release calendars.



PrimeFlow Trades publishes educational research and market commentary. Nothing on this page is investment advice or a recommendation to buy or sell any security. Trading involves risk, including the loss of money you invest. Past results, including any trade shown here, do not guarantee future results.