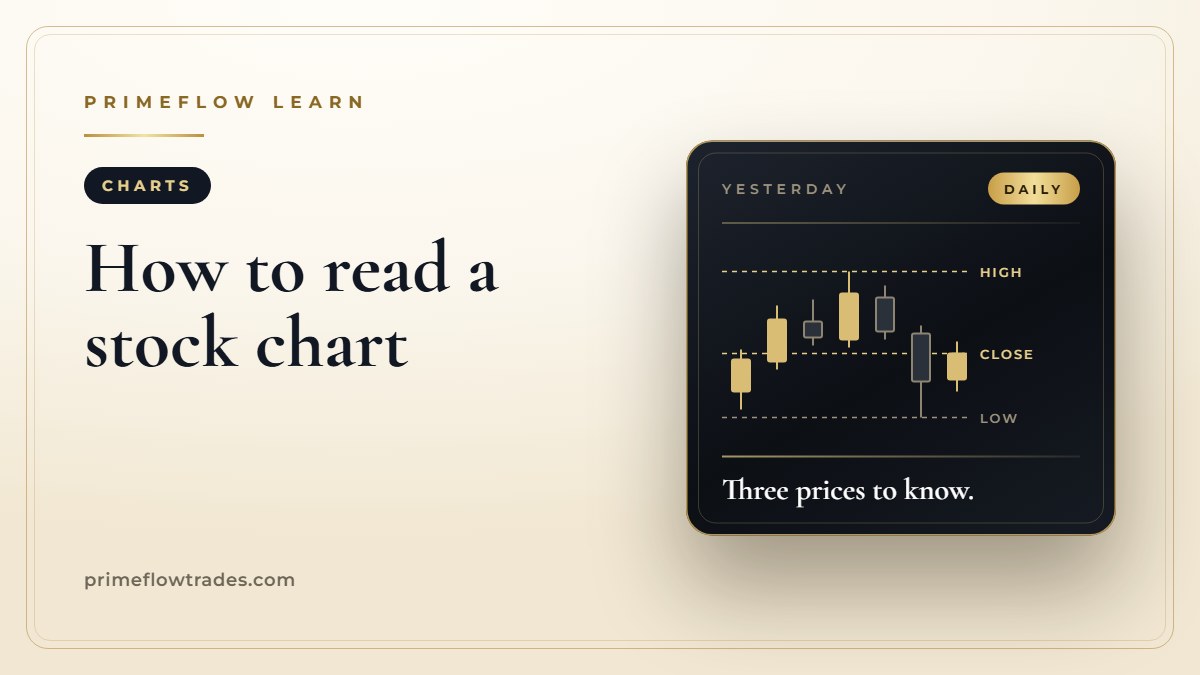
Learning how to read a stock chart takes one morning, not one semester. A stock chart is a record of what buyers and sellers actually paid, and for most buying decisions you need just three prices from it: yesterday’s high, yesterday’s low and yesterday’s close. Here is what each candle on the chart shows, where those three prices sit, and how to use them before you put money into a stock.
The short version
- Each candle shows four prices for one stretch of time: where it opened, the highest price, the lowest price and where it closed.
- Start with a daily chart. One candle is one trading day.
- Before the open, mark yesterday’s high, low and close. Those three lines tell you how today’s price compares with yesterday’s whole range.
- The volume bars along the bottom show how many shares changed hands, so you can tell a crowded move from a quiet one.
- A chart shows where a stock has been. Your plan decides what you will pay for it.
What a stock chart shows: price, time and volume
Every stock chart has the same three parts. Price runs up the right-hand side. Time runs along the bottom, from older on the left to newer on the right. And under the price you’ll usually find a row of bars showing volume, the number of shares traded in each period.
The simplest version is a line chart, which joins up one price per period, normally the closing price. It’s clean, but it hides a lot. A stock that swung 8% during the day and finished flat looks exactly like a stock that never moved.
That’s why most traders use candlestick charts. Each candle packs a whole period into one shape, so you can see the full fight between buyers and sellers, not just the final score.
How to read a candlestick: open, high, low and close
A candle has two parts. The thick part, the body, runs from the price where the period opened to the price where it closed. The thin lines above and below, called wicks, reach up to the highest price paid and down to the lowest.
On most charting apps, a green or hollow candle closed higher than it opened, and a red or filled candle closed lower than it opened. Colors vary from platform to platform, so check your app’s settings once and you’re set.
Here’s the detail that trips people up. The color compares the close with that same candle’s open, not with yesterday. A stock can open well above yesterday’s close, drift lower all day and still finish up on the day. Your quote screen says “up 4%,” and the daily candle is red. Both are right. The candle tells you the buyers who paid at the open ended the day holding a loss.
Long wicks matter too. A long upper wick means the stock traded much higher during the period but couldn’t hold it. Buyers paid up, and by the close the sellers had pushed the price back down.
Yesterday’s high, low and close: the three prices to mark
Before the market opens at 9:30 a.m. Eastern, put three lines on your chart.
- Yesterday’s high. The most anyone paid for the stock in yesterday’s session. If today’s price climbs above it, buyers are paying more than anyone was willing to pay yesterday.
- Yesterday’s low. The least anyone sold it for. A price below it means sellers are taking less than anyone accepted yesterday.
- Yesterday’s close. The last price of the regular session at 4:00 p.m. Eastern. Daily gains and losses on most quote screens are measured from this number, so “up 3%” means 3% above yesterday’s close.
Where the stock opens against those three lines tells you how the morning starts. Opening above yesterday’s high means the stock starts the day beyond its entire previous range. Opening between the high and low means it’s still inside familiar territory. Opening below the low means sellers got there first.
Many traders call the high and low resistance and support. You don’t need the labels. Price crosses these lines all the time, so treat them as a map of where the stock has been, not a forecast of where it’s going.
One setting matters here. Many charting apps can show trading before 9:30 and after 4:00. With that switched on, yesterday’s high might be a price that printed at 6:00 p.m. on a few hundred shares. The SEC warns that prices outside regular hours may not reflect prices during regular hours. Mark your three lines on a regular-hours chart, 9:30 a.m. to 4:00 p.m. Eastern. Our guide to premarket trading explains why those early prices can mislead.
How to read volume on a stock chart
The bars along the bottom of the chart show how many shares traded in each period. Taller bar, more shares, more people involved.
Volume is how you judge the price move above it. A stock pushing through yesterday’s high while volume runs well above a normal day has a crowd paying up. The same push on a thin trickle of shares can be a handful of orders, and it can reverse quickly once larger buyers and sellers show up.
Compare today’s volume with the stock’s usual day, not with other stocks. Two million shares is a big day for one company and a slow one for another.
How to read a stock chart before you buy
Five steps, done before 9:30, cover most of it.
- Open the daily chart with regular hours only, and look back a few weeks to see whether the stock has been climbing, falling or going sideways.
- Mark yesterday’s high, low and close.
- Note where the stock is trading now against those three lines: above the range, inside it or below it.
- Check the volume against the stock’s normal day.
- Write down the price you’ll pay. If the stock runs well past it, let it go.
Then let the opening minutes show you whether the move is holding. Our guide to the best time of day to trade stocks explains why the first hour is so busy, and why it pays to watch it before you buy.
How PrimeFlow alerts use the chart
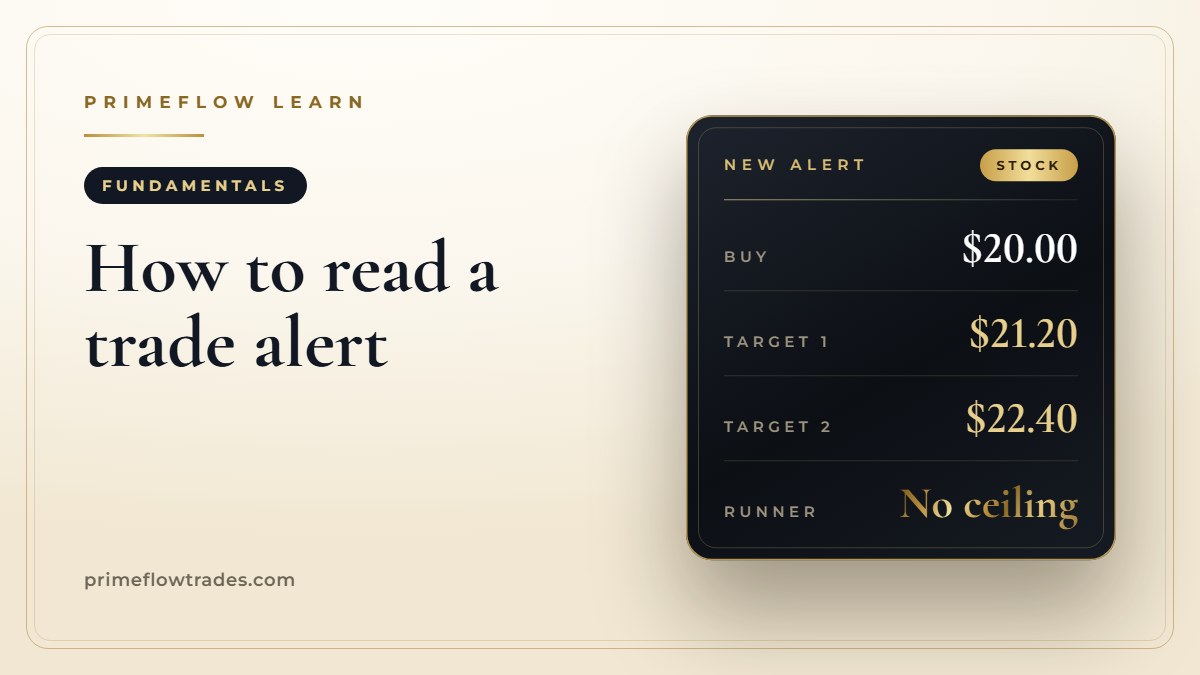
Every PrimeFlow alert gives you the buy price, two profit targets and a runner we let ride. When an alert lands, a quick look at the chart shows you where that buy price sits against yesterday’s range, and whether the stock is still near it or already well past it. Paying far above the alert’s buy price means paying more than the plan called for.
Our guide to reading a trade alert explains each number, and taking profits on stocks in steps shows how the two targets and the runner work together. Decide your position size first, too. Risk management basics shows the simple math.
The runner is where the chart gets fun to watch. Our VSH alert carried a buy price of $33.95 on May 8, 2026, and the stock reached $63.27 on June 3, 2026: up 86% in 26 days. Across our public trade log, 407 of our first 427 closed alerts were winners. Our free 40-Day Retirement Position guide shows how we hold a runner for weeks.
Mark three lines, check the volume, decide your price. That’s most of chart reading for a buyer. If you want the first stretch of the session laid out step by step, The 40 Minutes That Matter is where our desk starts every new trader.
Common questions
How do you read a stock chart for beginners?
Start with a daily candlestick chart. Each candle is one day: the body runs from the open to the close, and the thin lines show the day’s high and low. Then mark yesterday’s high, low and close, and check the volume bars along the bottom.
What do red and green candles mean on a stock chart?
On most charting apps, a green candle closed higher than it opened and a red candle closed lower than it opened. The color compares the close with that candle’s own open, so a stock can be up on the day and still show a red candle.
Why do traders watch yesterday’s high and low?
They show the full range buyers and sellers agreed on in the last session. Where today’s price sits against that range, above it, inside it or below it, tells you how the day is starting compared with yesterday.
What does volume mean on a stock chart?
Volume is the number of shares traded in each period, shown as bars under the price. A move on heavy volume has more buyers and sellers behind it than a move on light volume.
Is a line chart or a candlestick chart better for beginners?
A line chart is simpler, but it usually shows only the closing price. A candlestick chart also shows the open, high and low, which tells you far more about how the day actually went.
Can a stock chart tell you where the price will go?
No. A chart shows where a stock has traded, not where it will go. Use it to see where the price sits today and to decide in advance what you’ll pay.
Sources
- SEC: After-Hours Trading, Understanding the Risks
- FINRA: Extended-Hours Trading, Know the Risks
- FINRA Rule 2265: Extended Hours Trading Risk Disclosure
Trading hours and rules are summarized for general education. Check the hours and order types your broker offers.
PrimeFlow Trades publishes educational research and market commentary. Nothing on this page is investment advice or a recommendation to buy or sell any security. Trading involves risk, including the loss of money you invest. Past results, including any trade shown here, do not guarantee future results.